Hive Statistics – 2025.06

Welcome to the monthly analytical report about the Hive blockchain.
All the information presented in this report is based on the data collected from the blockchain until 2025-06-30 midnight UTC. This report aims to provide you with a clear view of what is happening on the Hive blockchain.
1. New users
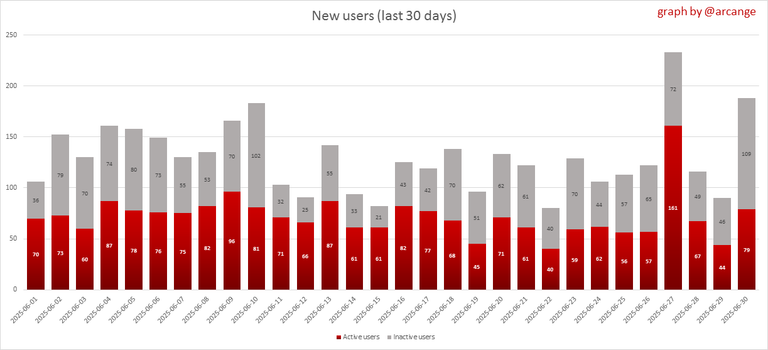
This chart shows the number of newly registered users on the blockchain and how many of them became active. The chart is kind of dynamic! A user can register one day and become active a few days later. Therefore, the number of active users on a specific date may change from day to day.
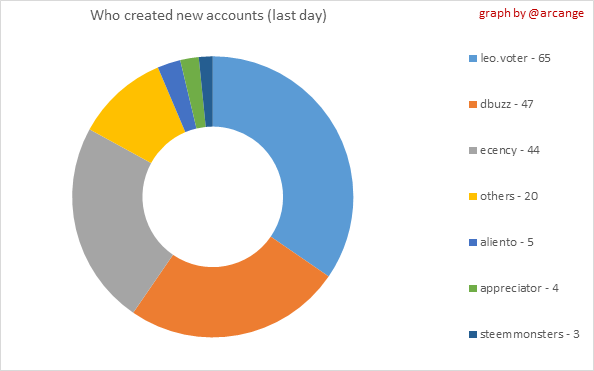 | 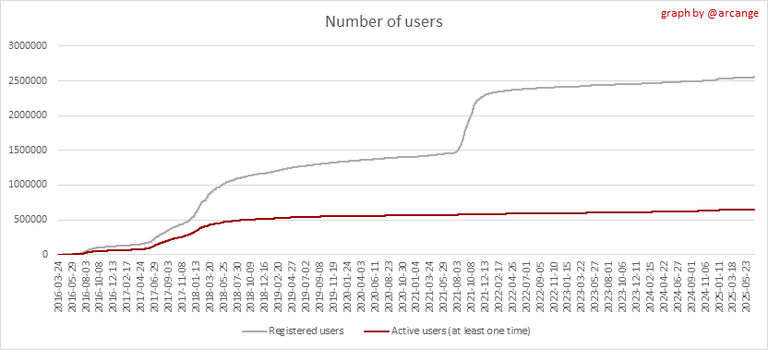 |
These two graphs show who created new accounts during the last day and the total number of registered accounts. The red line shows how many of them have been active at least once (active meaning publishing a post, commenting or voting). They are included even if they become inactive later.
2. Active users
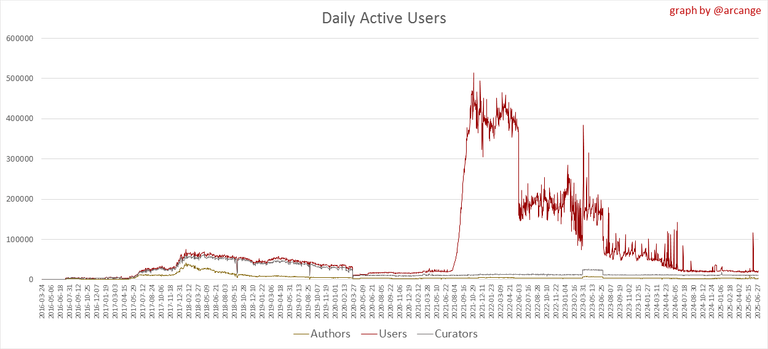 |  |

These graphs show the activity of users over time and in more detail the last 30 days. In these graphs, "active users" are those performing any type of transaction on the blockchain.
The last graph is a monthly summary of the active users. Be careful when interpreting the value of the last column which can be much lower if the end of the month has not yet been reached.
3. Apps
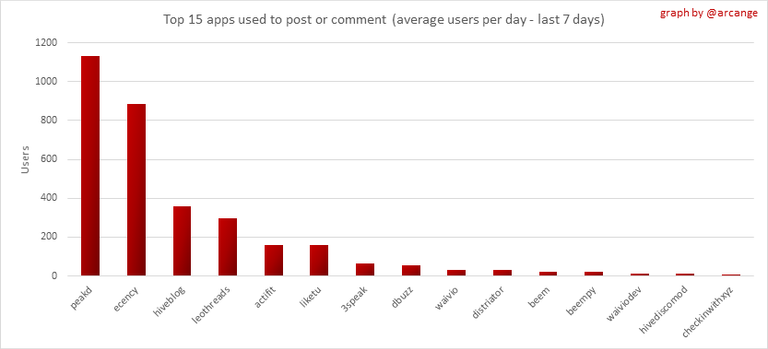
This graph shows which applications are most used to publish posts and comments. Please note that the same user can use several different applications.
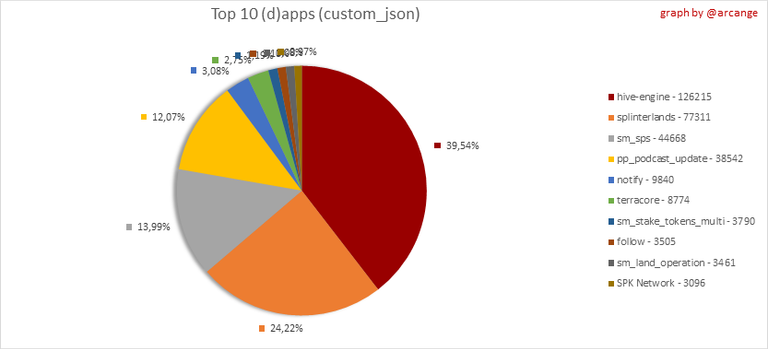
This graph shows which applications generate the most activity (custom_json operations) on the blockchain.
4. Posts And comments
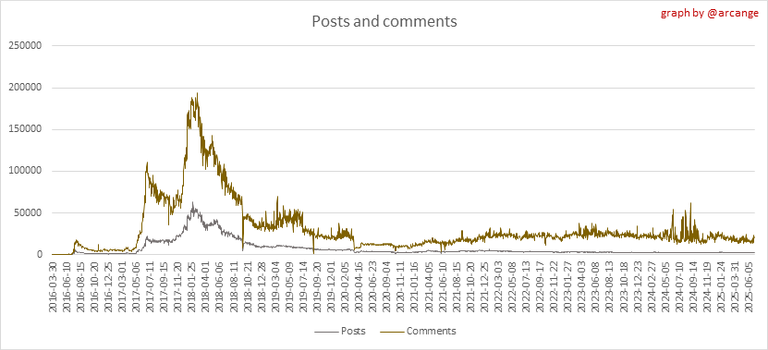 | 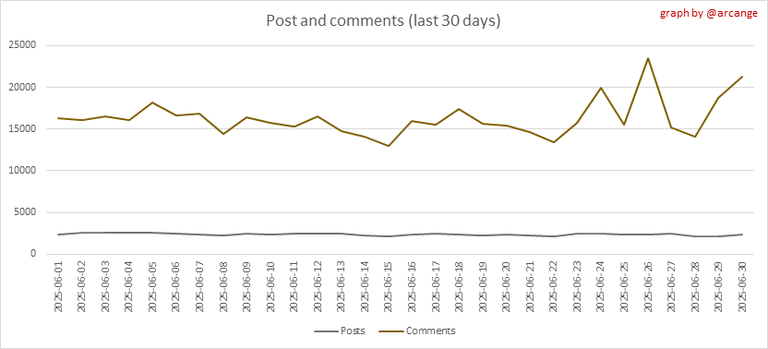 |
These graphs show the evolution of posts and comments for the whole blockchain lifetime and the last 30 days.
5. Curation
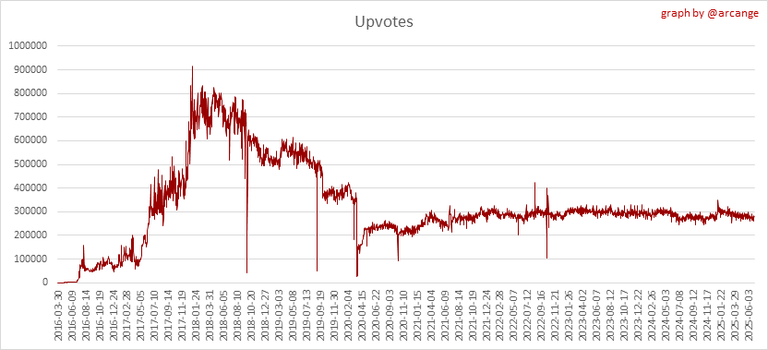 | 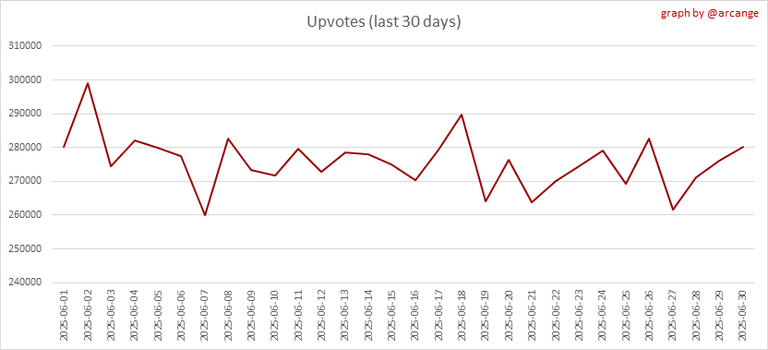 |
These graphs show the evolution of curation (upvotes) for the whole blockchain lifetime and the last 30 days.
6. Daily transactions
![]()
These graphs show the number of transactions per day, and the highest number of transactions per block, the average number of transactions per block, and the number of transactions per block for the last 48 hours. This gives you an idea of the whole activity on the blockchain.
![]()
This graph shows the distribution of the top 10 types of transactions by number of operations performed on the blockchain.
7. Communities and Tags
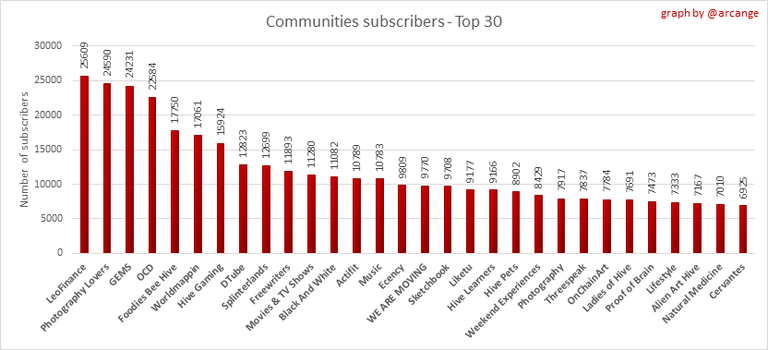
This graph shows the communities with the most subscribers.
 | 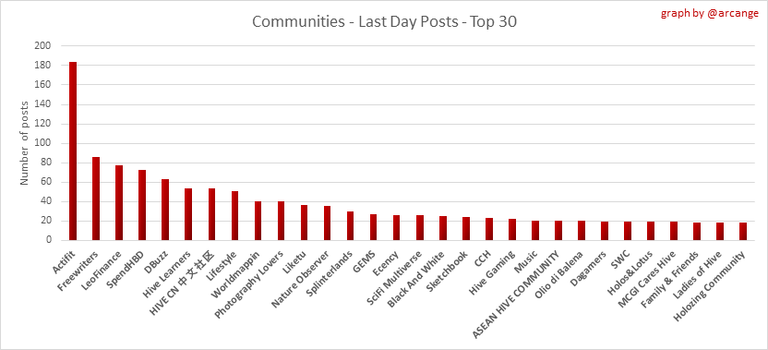 |
These graphs show the most active communities by number of posts (blockchain lifetime and last day).
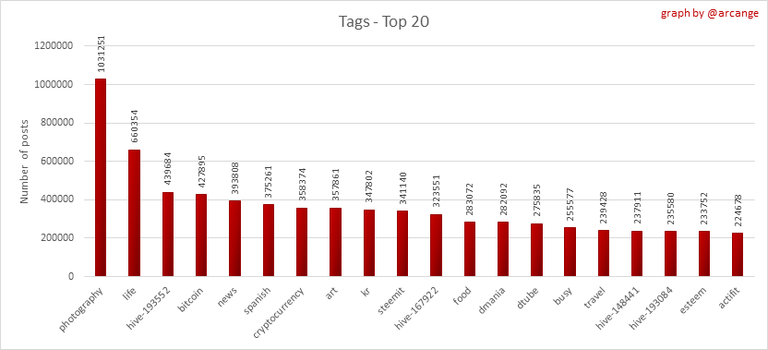 |  |
These graphs show which main tags have been the most used for publishing posts for the whole blockchain lifetime and the last day.
8. Distribution
 |  |  |  |  |
| < ~600 HP | >= ~600 HP | >= ~5996 HP | >= ~59958 HP | >= ~599578 HP |
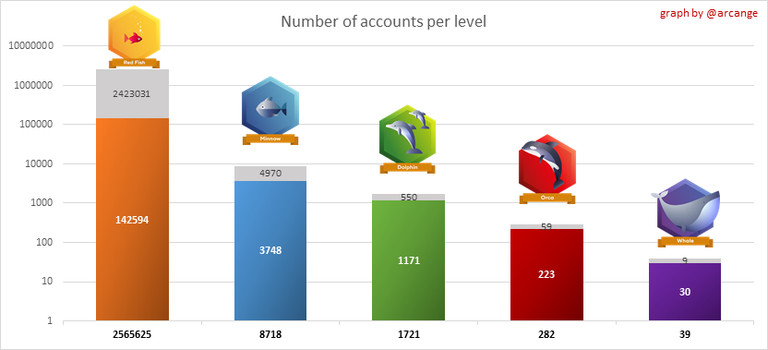 | 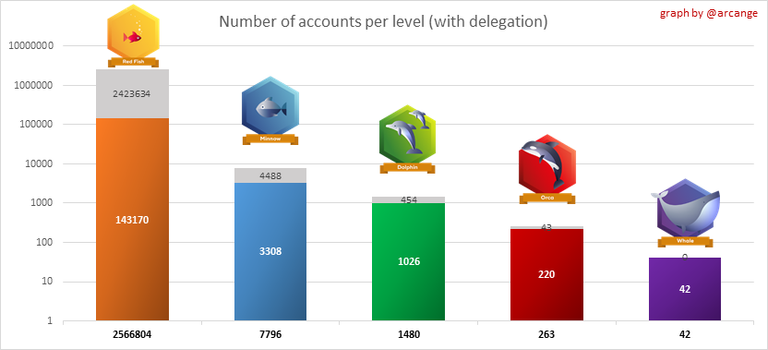 |
These graphs show the number of users according to their Hive Power. The left graph shows the distribution without taking into account any delegation made or received by the accounts. The right graph takes into account delegation, adds received HP delegation and subtracts given HP delegation.
The grey part of each column indicates how many accounts are inactive (those who have not posted, commented or voted the last 30 days).
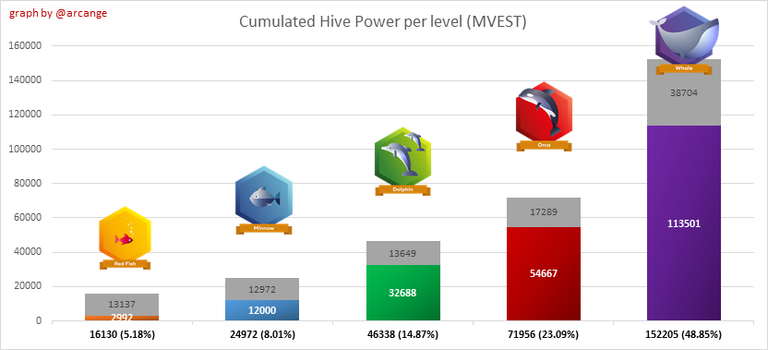 | 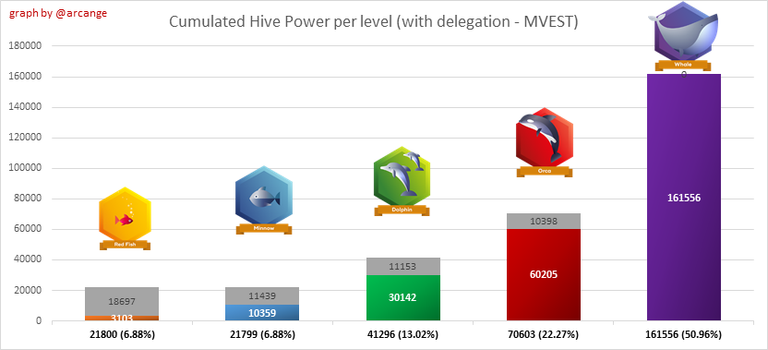 |
This graph shows the distribution of Hive Power cumulated per account level. The left graph shows the distribution without taking into account any delegation made or received by the accounts. The right graphs take into account delegation, adds received HP delegation and subtracts given HP delegation.
The grey part of each column indicates unused Hive Power by inactive accounts (see above the definition of inactive).
Below each column, you will also see a ratio to all existing Hive Power.
9. Payouts
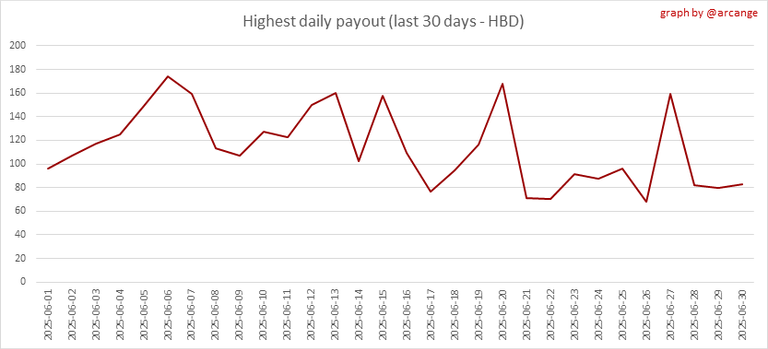
This graph shows the highest reward paid on a post (or comment) for the last 30 days.
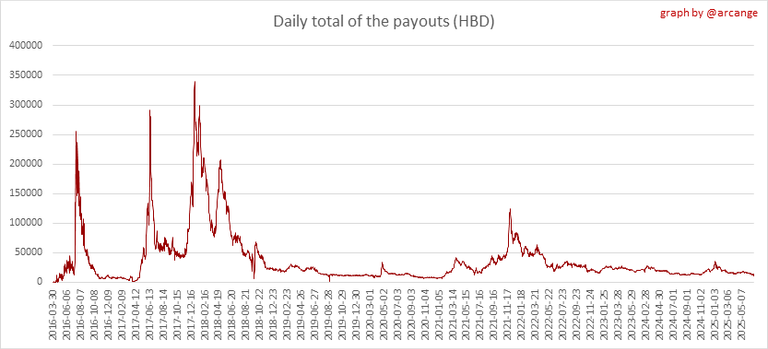 | 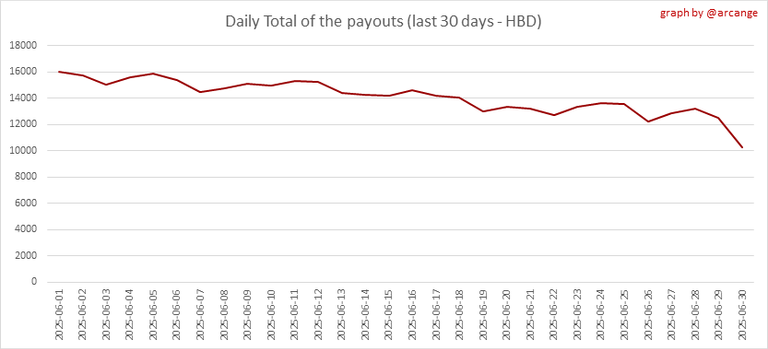 |
These graphs show the total of the distributed payout (posts and comments) for each day.
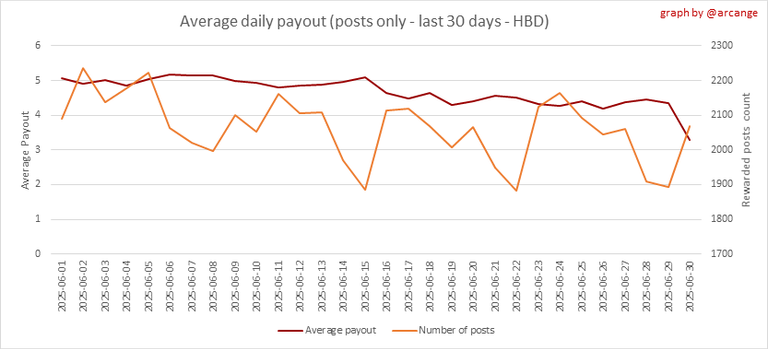 | 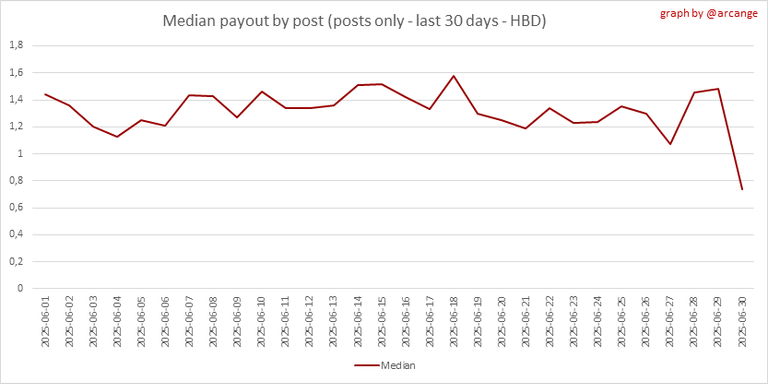 |
These graphs show the average and median payout per post for the last 30 days.
I hope you find those stats useful. If you would like to see additional stats, feel free to drop me a comment. Your feedback is welcome.
Thanks for reading.
Check out my apps and services


!BEER
View or trade
BEER.Hey @arcange, here is a little bit of
BEERfrom @pixresteemer for you. Enjoy it!Did you know that <a href='https://dcity.io/cityyou can use BEER at dCity game to buy cards to rule the world.
Above all, thank you very much for giving a great idea about this wonderful mobile app. I express my gratitude to you for sharing a wonderful post with information about witness voting. Thank you sir.
You're welcome @mdakash62
Yes you are most welcome my pleasure my dear sir
$WINE
It's always interesting to review the numbers. We always need to get more people active. Hive is a hidden treasure :)
!BEER
Yes, Hive has a lot of potential, and increasing active participation is key. Cheers 🍻
!PIZZA
@arcange, sorry! You need more to stake more $PIZZA to use this command.
The minimum requirement is 20.0 PIZZA staked.
More $PIZZA is available from Hive-Engine or Tribaldex
View or trade
BEER.Hey @arcange, here is a little bit of
BEERfrom @steevc for you. Enjoy it!We love your support by voting @detlev.witness on HIVE .
View or trade
BEER.Hey @arcange, here is a little bit of
BEERfrom @steevc for you. Enjoy it!Learn how to earn FREE BEER each day by staking your
BEER.As someone who did stats in uni these graphs make me happy. You precent the data really well. Also cool to see LOH in one of the top used thingos.
Thank you for the kind words @artofkylin! Glad to hear that you appreciate the presentation of the data.